October 2024 queue retrospective
Darwin Wu· 11/7/2024 · 6 min read
Within October there have been multiple infrastructure upgrades to our queueing system, some of which unfortunately resulted in incidents. While none of these incidents caused data loss we understand the impact that degraded performance brings, and for that we apologise.
Here we’ll walk through each of the issues that occurred, why they happened, and our fixes, improvements, and changes in processes. Each section correlates to the incident title in status.inngest.com for easier reference.
Before we dive in, there’s good news: the continued infrastructure improvements rolled out during the last 4 weeks reduce the P95 execution latency to ~50ms, across tens of thousands of steps concurrently per user, allowing you to ship ever increasing scale to us.
10/4/2024 - Degraded performance
A release was made on this date to improve high cardinality multi-tenant flow control handling. The project is called Key Queues internally, with other improvements to make queue processing more efficient. After doing months of extensive testing, we proceeded with a production rollout.
As this rolled out we saw a dive in processing throughput, triggering multiple alerts. We identified the issue and decided to rollback the change.
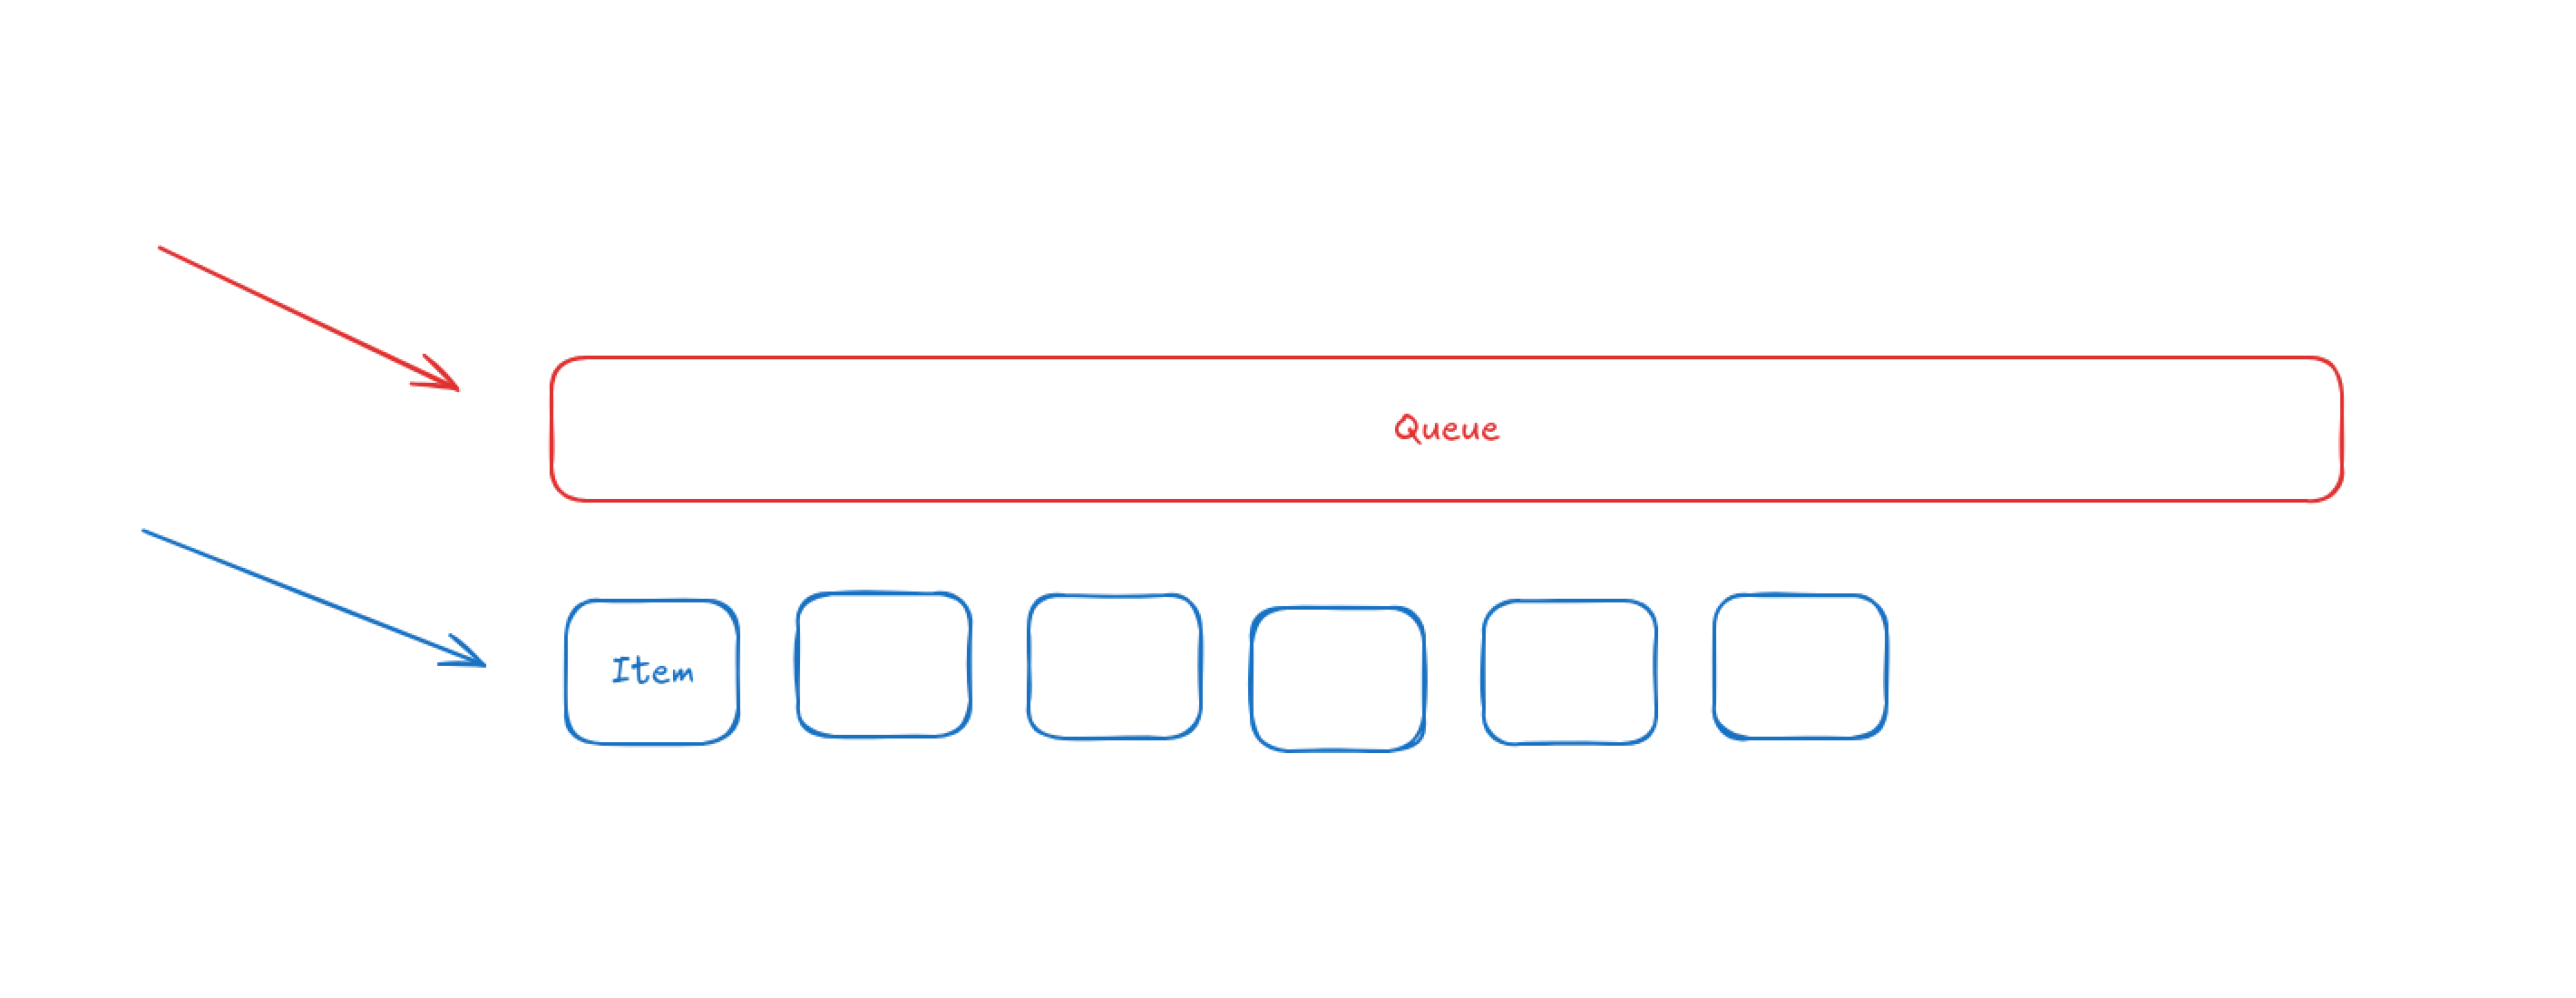
At a high level, the new design of individual queue processing became less efficient in aggregate when under high load with extreme custom key cardinality, due to the exponential increase of the number of queues internally.

Processing each individual queue requires 4x the number of operations than processing an individual queue item. Unfortunately, these changes dramatically increased the number of queues processed when under extreme cardinality, which lowered capacity for processing each individual item for those users affected.
In order words, we end up processing many more queues, with significantly fewer items in each queue (quite often, single queue items) — decreasing throughput.
Reverting the Key Queues partially also reverted the proliferation of smaller queues. After doing some house keeping after the partial revert, we were able to get throughput back to what it was prior to the release.
Follow ups
While the logic was sound in theory and during testing, the impact of increasing queue operations by orders of magnitude negatively impacted production workloads. An improved load testing suite on staging environments is planned, and internally a new design for extremely high key queue cardinality is underway. Internal tests with long-tail cardinality cover these edge cases.
10/9/2024 - Execution and Cron delays
An improvement and refactor to improve our cron service resulted in delayed crons for ~52 minutes. The improvement switched the backing store for cron management.
Follow ups
Specific cron service alerts have been adjusted to automatically create incidents based off of the volume of cron schedules.
10/11/2024 - Function run status update issues
During the incident on 10/9, we found that the data pipeline (NATS) used for function run spans were not handling data publishing reliably sometimes.
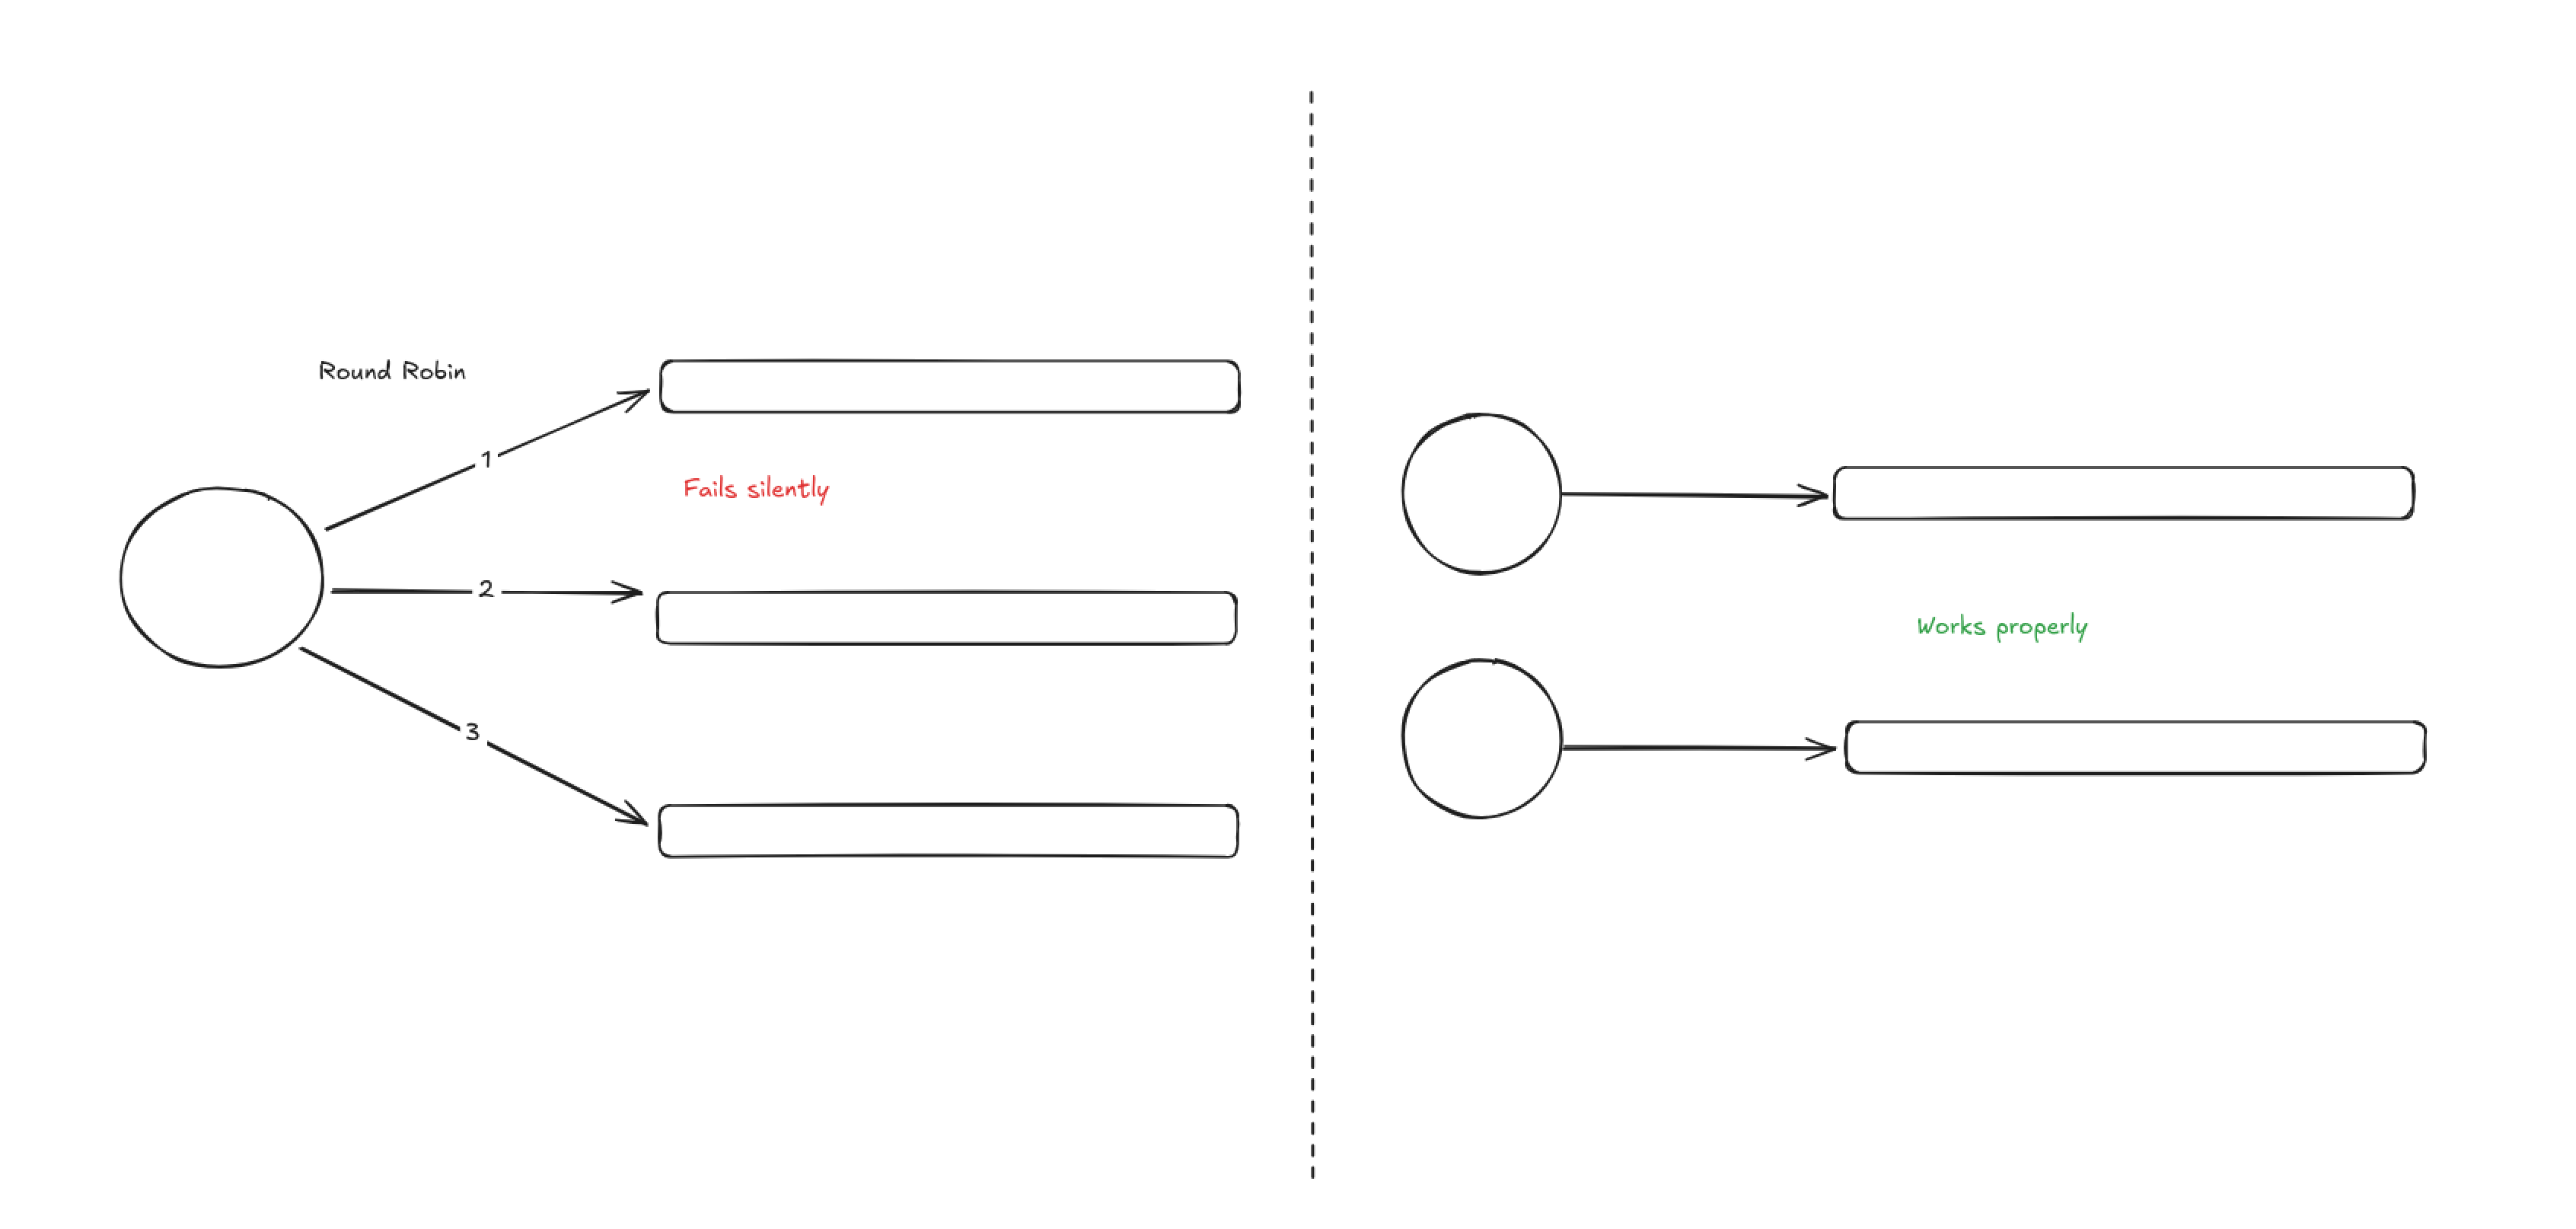
An attempt was made to handle data publishing by splitting out the message stream, and dynamically round robin between them on publish to reduce the load on a single stream.
Though it look like it was a success initially, this change was silently failing on publishing within NATS itself. This was caught by observing metrics we’ve put in around NATS.
The changes was immediately reverted, and instead of round robin the publishing of function runs data, we decided to assign message streams in a more permanent way.

After changing it to a permanent assignment, the metrics also went back to normal so we were able to confirm that data publishing are working correctly again.
Follow ups
We’ve changed our NATS alerting to be more sensitive to publish/subscribe imbalances, and we’ve further partitioned our NATS clusters for reliability.
Though we’ve put effort into making it more reliable, there are some fundamental issues with NATS when it comes to data publishing in general when using Jetstream. A longer term remediation will be to move away from NATS, and go back to good old Kafka instead.
10/18/2024 - Delayed execution for some function runs
Our primary queue shard’s CPU usage spiked due to increased load, increasing the duration for all queue operations. This in turn decreased queue throughput, which added latency and delayed runs.
Work to shard the queue had already taken place, and we focused additional effort in building functionality to migrate users across individual queue shards. We provisioned additional infrastructure, then began to test migrating accounts on staging then production (starting with our own).
After successful testing, we started to move customers to the new shards. Migrated users noticed an extreme drop in latency — with a P95 of 10-50ms. Due to the potential for significant impact, we carefully observed each migration, then proceeded to rebalance new tenants in batches.
As accounts move to different shards, the load on the pathological queue decreased. Performance is now up across the board, with significantly lower P95s on average.
10/22/2024 - Sporadic delayed event matching
We started seeing sporadic delays in event matching for waitForEvent and cancelOn. The queue sharding migration was still underway for the remaining groups of accounts, which increased capacity for event matching. This resolved sporadic delays.
10/24/2024 - step.waitForEvent and cancelOn processing issues
On Tuesday the 22nd, we investigated an incident affecting the event matching service where users experienced significant processing delays for cancelOn and waitForEvent operations.
The root cause was traced to unoptimized expressions being processed at high volumes, causing the service to occasionally backlog. Event matching is, naively, a quadratic operation. Every event received needs to be matched against every waitForEvent or cancelOn saved. We have a service that optimizes this to run close to a millisecond, however this service failed to optimize a specific expression in our system.
Follow ups
Our team implemented several immediate improvements to resolve the situation, including optimizing expression handling, adjusting worker configurations, and implementing dynamic scaling based on resource utilization metrics. We're also rolling out additional safeguards, including complexity alerting to prevent unoptimized expressions from affecting other parts of the system.
10/30/2024 - Degraded UI and DB performance
On Wednesday the 30th, we investigated an incident which prevented our UI from being accessible and caused app sync performance to degrade.
The root cause of this was a disk issue within our Postgres RDS instance, which maintains metadata around accounts, environments, and functions. Unfortunately, our disk queue depth rapidly increased despite our query patterns and disk IO remaining within relative bounds.
We immediately moved reads to a read replica, improved local caching for perf, and applied maintenance to our primary Postgres instance. Within approximately an hour, service was restored without data loss.
Chat with a solutions expert
Connect with us to see if Inngest fits your queuing and orchestration needs.
Contact us